How Sanitizer Get Stack Trace
本文以 ASan 为例分析 sanitizer runtime 是如何获取和保存 stack trace 的。
Sanitizer 非常好用的一个原因就是报告的内容非常详细。例如 ASan 检测到一个 heap-use-after-free 类型的 bug,在报告中不仅会给出执行哪行代码时触发了 heap-use-after-free,还会给出这块堆内存是在哪里被申请的,又是在哪里被释放的。
例如下面这个 heap-use-after-free 的例子:
“READ of size 4 at 0x603e0001fc64 thread T0” 给出的是触发 heap-use-after-free 的 stack trace
“freed by thread T0 here:” 给出的是堆内存被释放时的 stack trace
“previously allocated by thread T0 here:” 给出的是堆内存被申请时的 stack trace
// clang -O0 -g -fsanitize=address test.cpp && ./a.out
int main(int argc, char **argv) {
  int *array = new int[100];
  delete [] array;
  return array[argc];  // BOOM
}
=================================================================
==6254== ERROR: AddressSanitizer: heap-use-after-free on address 0x603e0001fc64 at pc 0x417f6a bp 0x7fff626b3250 sp 0x7fff626b3248
READ of size 4 at 0x603e0001fc64 thread T0
    #0 0x417f69 in main test.cpp:5
    #1 0x7fae62b5076c (/lib/x86_64-linux-gnu/libc.so.6+0x2176c)
    #2 0x417e54 (a.out+0x417e54)
0x603e0001fc64 is located 4 bytes inside of 400-byte region [0x603e0001fc60,0x603e0001fdf0)
freed by thread T0 here:
    #0 0x40d4d2 in operator delete[](void*) llvm/projects/compiler-rt/lib/asan/asan_new_delete.cc:61
    #1 0x417f2e in main test.cpp:4
previously allocated by thread T0 here:
    #0 0x40d312 in operator new[](unsigned long) llvm/projects/compiler-rt/lib/asan/asan_new_delete.cc:46
    #1 0x417f1e in main test.cpp:3
Shadow bytes around the buggy address:
  0x1c07c0003f30: fa fa fa fa fa fa fa fa fa fa fa fa fa fa fa fa
  0x1c07c0003f40: fa fa fa fa fa fa fa fa fa fa fa fa fa fa fa fa
  0x1c07c0003f50: fa fa fa fa fa fa fa fa fa fa fa fa fa fa fa fa
  0x1c07c0003f60: fa fa fa fa fa fa fa fa fa fa fa fa fa fa fa fa
  0x1c07c0003f70: fa fa fa fa fa fa fa fa fa fa fa fa fa fa fa fa
=>0x1c07c0003f80: fa fa fa fa fa fa fa fa fa fa fa fa[fd]fd fd fd
  0x1c07c0003f90: fd fd fd fd fd fd fd fd fd fd fd fd fd fd fd fd
  0x1c07c0003fa0: fd fd fd fd fd fd fd fd fd fd fd fd fd fd fd fd
  0x1c07c0003fb0: fd fd fd fd fd fd fd fd fd fd fd fd fd fd fa fa
  0x1c07c0003fc0: fa fa fa fa fa fa fa fa fa fa fa fa fa fa fa fa
  0x1c07c0003fd0: fa fa fa fa fa fa fa fa fa fa fa fa fa fa fa fa
Shadow byte legend (one shadow byte represents 8 application bytes):
  Addressable:           00
  Partially addressable: 01 02 03 04 05 06 07
  Heap left redzone:     fa
  Heap righ redzone:     fb
  Freed Heap region:     fd
  Stack left redzone:    f1
  Stack mid redzone:     f2
  Stack right redzone:   f3
  Stack partial redzone: f4
  Stack after return:    f5
  Stack use after scope: f8
  Global redzone:        f9
  Global init order:     f6
  Poisoned by user:      f7
  ASan internal:         fe
==6254== ABORTING
本文以 ASan 为例分析 sanitizer runtime 是如何获取 stack trace 的。
Stack unwinding
在分析 sanitizer runtime 关于 stack trace 的具体实现之前,我们先来学习下 stack unwinding。
关于 stack unwinding,maskray 这篇文章 Stack unwinding | MaskRay 写的非常好。本节的内容都是从 maskray 这篇文章习来的。
Stack unwinding 主要用于获取 stack trace 或 实现 C++ exception。
Stack unwinding 可以分为两类:
- synchronous: 由程序自身触发的,只发生在函数调用处(在 function body 内,不会出现在 prologue/epilogue 处)。
- asynchronous: 由 garbage collector, signal 或外部程序触发,这类 stack unwinding 可以发生在函数 prologue/epilogue 处。
Sanitizer 的 stack unwinding 就是 synchronous stack unwinding,由 sanitizer runtime 自身触发。例如 sanitizer runtime 在 malloc/free 时会通过 stack unwinding 获取 stack trace。
因此本文中我们只讨论 synchronous stack unwinding(而且我也不了解 asynchronous stack unwinding,以后有时间可以学习下)。
Frame pointer
最朴素的 stack unwinding 就是基于 frame (base) pointer [%rbp] 来实现的。如果编译时添加了选项 -fno-omit-frame-pointer,那么在函数 prologue/epilogue 处会有如下指令:
pushq %rbp
movq %rsp, %rbp
...
popq %rbp
ret
函数 prologue 处 pushq %rbp 将 caller 的 frame pointer 值压栈,movq %rsp, %rbp 将寄存器 %rbp 的值更新为保存 caller frame pointer 的栈地址。这样,一旦我们获取了当前函数的 frame pointer 的值,将其解引用后就可以得到 caller 的 frame pointer 的值,不停地解引用就能获取到所有栈帧的 frame pointer。
我们可以将 stack frame 抽象为如下结构体:
struct stack_frame {
  stack_frame* nextFrame;
  void* returnAddress;
};
以如下汇编代码为例进行说明:在 x86_64 下,caller 会在执行 call 指令时会将当前函数的下一条指令地址压栈,然后跳转到 callee 的入口处继续执行,接着在 callee 的第一条指令就是 pushq %rbp 将寄存器 %rbp 的值压栈。这两条指令合作将 struct stack_frame 的内容填充好。
main:                                   # @main
        pushq   %rbp
        movq    %rsp, %rbp
        subq    $16, %rsp
        movl    $0, -4(%rbp)
        movl    $2, %edi
        callq   foo(int) # Pushes address of next instruction onto stack,
                         # populating 'returnAddress' member of 'stack_frame'.
                         # Then jumps to 'callee' address(i.e. function foo).
        addl    $1, %eax
        addq    $16, %rsp
        popq    %rbp
        retq

foo:                                # @foo(int)
        pushq   %rbp       # Push rbp (stack_frame ptr) onto stack (populates 'nextFrame' member)
        movq    %rsp, %rbp # Update rbp to point to new stack_frame
        subq    $16, %rsp. # Reserve an additional 16 bytes of stack-space
        movl    %edi, -4(%rbp)
        movl    -4(%rbp), %edi
        callq   bar(int)
        addl    $2, %eax
        addq    $16, %rsp. # Restore rsp
        popq    %rbp       # Pop rbp from stack
        retq               # Pop return address from top of stack and jump to it
因此我们可以通过 _builtin_frame_address(0) 得到当前函数的 frame pointer 值,解引用 frame pointer 即可得到 nextFrame 和 returnAddress,不断重复,这样我们就能获取到 stack trace 了。
一个简单的 unwinding 代码示例实现 test_unwind.cpp 如下:
 1  #include <stdio.h>
 2
 3  __attribute__((noinline)) void fast_unwind() {
 4    unsigned long *frame = (unsigned long *)__builtin_frame_address(0);
 5    for (;;) {
 6      printf("frame pointer is: %p\n", frame);
 7      unsigned long *pc = (unsigned long*)frame[1];
 8      printf("pc is: %p\n", pc);
 9      unsigned long *new_frame = (unsigned long *)(*frame);
 10      if (*new_frame <= *frame) break;
 11      frame = new_frame;
 12    }
 13  }
 14
 15  __attribute__((noinline)) int bar(int n) {
 16    if (n <= 0)
 17      return 0;
 18    if (n == 1)
 19      return 1;
 20    fast_unwind();
 21    return bar(n-1) + bar(n-2);
 22  }
 23
 24  __attribute__((noinline)) int foo(int n) {
 25    return bar(n)+2;
 26  }
 27
 28  int main() {
 29    return foo(2)+1;
 30  }
$ clang++ test_unwind.cpp -g -no-pie -fno-omit-frame-pointer && ./a.out
frame pointer is: 0x7ffcbde94c10
pc is: 0x4011ec
frame pointer is: 0x7ffcbde94c30
pc is: 0x401233
frame pointer is: 0x7ffcbde94c50
pc is: 0x401259

$ llvm-symbolizer -iCfe a.out 0x4011ec 0x401233 0x401259
bar(int)
test-stack-trace/test_unwind.cpp:21:14
foo(int)
test-stack-trace/test_unwind.cpp:25:16
main
test-stack-trace/test_unwind.cpp:29:16
但是这种基于 frame pointer 实现 stack unwinding 的方式有很大的局限性:编译器默认只有在 O0 优化等级下会添加 -fno-omit-frame-pointer 编译选项,并且预留一个寄存器用于存储 frame pointer 与不预留一个寄存器存储 frame pointer 相比会有额外的性能开销。
DWARF Call Frame Information
另一种 stack unwinding 的实现方式就是基于 DWARF Call Frame Information 来实现的,由 compiler/assembler/linker/libunwind 提供相应支持。
我们还是以例子进行说明:
$ cat test.cpp
__attribute__((noinline)) int bar(int n) {
  if (n <= 0)
    return 0;
  if (n == 1)
    return 1;
  return bar(n-1) + bar(n-2);
}

__attribute__((noinline)) int foo(int n) {
  return bar(n)+2;
}

int main() {
  return foo(2)+1;
}

# 生成 test_unwind.s
$ clang++ -O1 test.cpp -S
我们可以在 test.s 中看到 .cfi_def_cfa_offset, .cfi_offset 这样的 CFI directives,assembler/linker 会根据这些 CFI directives 生成 .eh_frame section,最终用于 stack unwinding。
例如在汇编文件 test.s 中函数 bar 对应的汇编代码中有如下内容:
_Z3bari:                                # @_Z3bari
    .cfi_startproc
# %bb.0:                                # %entry
    pushq    %rbp
    .cfi_def_cfa_offset 16
    pushq    %rbx
    .cfi_def_cfa_offset 24
    pushq    %rax
    .cfi_def_cfa_offset 32
    .cfi_offset %rbx, -24
    .cfi_offset %rbp, -16
    testl    %edi, %edi
    jle    .LBB0_1
我们手动将 .cfi_offset %rbp, -16 修改为 .cfi_offset %rbp, -24,然后将 test.s 编译为可执行文件,并用 gdb 调试看下会有什么影响:
$ clang test.s
$ gdb ./a.out
(gdb) b bar
(gdb) r
(gdb) ni
(gdb) ni
(gdb) ni
(gdb) disassemble
Dump of assembler code for function _Z3bari:
   0x0000000000401110 <+0>:    push   %rbp
   0x0000000000401111 <+1>:    push   %rbx
   0x0000000000401112 <+2>:    push   %rax
=> 0x0000000000401113 <+3>:    test   %edi,%edi
(gdb) i r rbx rbp
rbx            0x0                 0
rbp            0x401170            0x401170 <__libc_csu_init>
(gdb) bt
#0  0x0000000000401110 in bar(int) ()
#1  0x0000000000401156 in foo(int) ()
#2  0x000000000040116b in main ()
(gdb) f 1
#1  0x0000000000401156 in foo(int) ()
(gdb) i r rbx rbp
rbx            0x0                 0
rbp            0x0                 0x0
我们让程序停在 bar 函数中 test %edi,%edi 处,然后运行程序。可以看到在断点处 rbp 的值是 0x401170,rbx 的值是 0,跳转至 frame 1 后,再次看 rbp 的值,此时变为了 0。然而应当跳转至 frame 1 处和 rbp 的值也应该是 0x401170,变成 0 是因为我们将汇编文件 test.s 中 .cfi_offset %rbp, -16 修改为了 .cfi_offset %rbp, -24。而 cfi_offset -24 处存储的是 %rbx 的值,%rbx 的值是 0,所以 gdb 将 frame 1 的 %rbp 的值恢复为了 0。
这样我们通过这样一个简单的例子管中窥豹了解了基于 DWARF Call Frame Information 的 stack unwinding。
Sanitizer stack trace
Sanitizer runtime 在 stack unwinding 时,有两种策略:fast unwind 和 slow unwind,sanitizer runtime 优先使用 fast unwind。
在 sanitizer runtime 中有很多地方都需要收集 stack trace,例如在 malloc/free 被调用时收集 stack trace。在 ASan runtime library 中 intercptor malloc/free 函数实现中就通过宏 GET_STACK_TRACE_MALLOC 和 GET_STACK_TRACE_FREE 来获取 stack trace 保存至 BufferedStackTrace 类型的变量 stack 中,然后将 stack 作为参数传给函数 asan_malloc, asan_free 保存起来。
// compiler-rt/lib/asan/asan_malloc_linux.cpp

INTERCEPTOR(void*, malloc, uptr size) {
  if (DlsymAlloc::Use())
    return DlsymAlloc::Allocate(size);
  ENSURE_ASAN_INITED();
  GET_STACK_TRACE_MALLOC;
  return asan_malloc(size, &stack);
}

INTERCEPTOR(void, free, void *ptr) {
  if (DlsymAlloc::PointerIsMine(ptr))
    return DlsymAlloc::Free(ptr);
  GET_STACK_TRACE_FREE;
  asan_free(ptr, &stack, FROM_MALLOC);
}
GET_STACK_TRACE_MALLOC 和 GET_STACK_TRACE_FREE 宏展开后经过一系列的调用,最终执行的是 BufferedStackTrace::Unwind():
BufferedStackTrace::Unwind() 函数的各个参数含义如下:
max_depth:设置 unwind 最大回溯的深度。
pc: the pc will be in the position 0 of the resulting stack trace. 即 unwind 起始处的 pc,是通过
__builtin_return_address(0)得到的。bp: the bp may refer to the current frame or to the caller’s frame. 即 unwind 起始处的 frame address,是通过
__builtin_frame_address(0)得到的。context: 通常为 nullptr。在 Android lollipop 版本之前,从 signal handler 中 unwind 要基于 libcorkscrew.so,需要用到 signal handler 提供的 context 参数。
stack_top, stack_bottom: unwind 起始处所在线程的线程栈底和线程栈顶,主要用于判断采取 fast unwind 时 unwind 过程何时终止。
request_fast_unwind: 表示是使用 fast unwind 还是 slow unwind。在环境变量 ASAN_OPTIONS 中可以设置运行时参数 fast_unwind_on_check, fast_unwind_on_fatal, fast_unwind_on_malloc,sanitizer 会根据这些参数的设置以及运行环境是否支持选择使用 fast unwind 还是 slow unwind。
fast_unwind_on_check: If available, use the fast frame-pointer-based unwinder on internal CHECK failures. Defaults to false.
fast_unwind_on_fatal: If available, use the fast frame-pointer-based unwinder on fatal errors. Defaults to false.
fast_unwind_on_malloc: If available, use the fast frame-pointer-based unwinder on malloc/free. Defaults to true.
// compiler-rt/lib/sanitizer_common/sanitizer_stacktrace_libcdep.cpp

void BufferedStackTrace::Unwind(u32 max_depth, uptr pc, uptr bp, void *context,
                                uptr stack_top, uptr stack_bottom,
                                bool request_fast_unwind) {
  // Ensures all call sites get what they requested.
  CHECK_EQ(request_fast_unwind, WillUseFastUnwind(request_fast_unwind));
  top_frame_bp = (max_depth > 0) ? bp : 0;
  // Avoid doing any work for small max_depth.
  if (max_depth == 0) {
    size = 0;
    return;
  }
  if (max_depth == 1) {
    size = 1;
    trace_buffer[0] = pc;
    return;
  }
  if (!WillUseFastUnwind(request_fast_unwind)) {
#if SANITIZER_CAN_SLOW_UNWIND
    if (context)
      UnwindSlow(pc, context, max_depth);
    else
      UnwindSlow(pc, max_depth);
    // If there are too few frames, the program may be built with
    // -fno-asynchronous-unwind-tables. Fall back to fast unwinder below.
    if (size > 2 || size >= max_depth)
      return;
#else
    UNREACHABLE("slow unwind requested but not available");
#endif
  }
  UnwindFast(pc, bp, stack_top, stack_bottom, max_depth);
}
UnwindFast
UnwindFast 其实就是基于 frame pointer 的 unwind,具体实现如下:
// llvm-project/compiler-rt/lib/sanitizer_common/sanitizer_stacktrace.cpp
void BufferedStackTrace::UnwindFast(uptr pc, uptr bp, uptr stack_top,
                                    uptr stack_bottom, u32 max_depth) {
  // TODO(yln): add arg sanity check for stack_top/stack_bottom
  CHECK_GE(max_depth, 2);
  const uptr kPageSize = GetPageSizeCached();
  trace_buffer[0] = pc;
  size = 1;
  if (stack_top < 4096) return;  // Sanity check for stack top.
  uhwptr *frame = GetCanonicFrame(bp, stack_top, stack_bottom);
  // Lowest possible address that makes sense as the next frame pointer.
  // Goes up as we walk the stack.
  uptr bottom = stack_bottom;
  // Avoid infinite loop when frame == frame[0] by using frame > prev_frame.
  while (IsValidFrame((uptr)frame, stack_top, bottom) &&
         IsAligned((uptr)frame, sizeof(*frame)) &&
         size < max_depth) {
    uhwptr pc1 = frame[1];
    // Let's assume that any pointer in the 0th page (i.e. <0x1000 on i386 and
    // x86_64) is invalid and stop unwinding here.  If we're adding support for
    // a platform where this isn't true, we need to reconsider this check.
    if (pc1 < kPageSize)
      break;
    if (pc1 != pc) {
      trace_buffer[size++] = (uptr) pc1;
    }
    bottom = (uptr)frame;
    frame = GetCanonicFrame((uptr)frame[0], stack_top, bottom);
  }
}

static inline uhwptr *GetCanonicFrame(uptr bp,
                                      uptr stack_top,
                                      uptr stack_bottom) {
  CHECK_GT(stack_top, stack_bottom);
  return (uhwptr*)bp;
}

// Check if given pointer points into allocated stack area.
static inline bool IsValidFrame(uptr frame, uptr stack_top, uptr stack_bottom) {
  return frame > stack_bottom && frame < stack_top - 2 * sizeof (uhwptr);
}
UnwindSlow
UnwindSlow 就是基于 libunwind 提供的接口 _Unwind_Backtrace 来实现的 unwind:
// llvm-project/compiler-rt/lib/sanitizer_common/sanitizer_unwind_linux_libcdep.cpp
void BufferedStackTrace::UnwindSlow(uptr pc, u32 max_depth) {
  CHECK_GE(max_depth, 2);
  size = 0;
  UnwindTraceArg arg = {this, Min(max_depth + 1, kStackTraceMax)};
  _Unwind_Backtrace(Unwind_Trace, &arg);
  // We need to pop a few frames so that pc is on top.
  uptr to_pop = LocatePcInTrace(pc);
  // trace_buffer[0] belongs to the current function so we always pop it,
  // unless there is only 1 frame in the stack trace (1 frame is always better
  // than 0!).
  // 1-frame stacks don't normally happen, but this depends on the actual
  // unwinder implementation (libgcc, libunwind, etc) which is outside of our
  // control.
  if (to_pop == 0 && size > 1)
    to_pop = 1;
  PopStackFrames(to_pop);
  trace_buffer[0] = pc;
}

struct UnwindTraceArg {
  BufferedStackTrace *stack;
  u32 max_depth;
};

_Unwind_Reason_Code Unwind_Trace(struct _Unwind_Context *ctx, void *param) {
  UnwindTraceArg *arg = (UnwindTraceArg*)param;
  CHECK_LT(arg->stack->size, arg->max_depth);
  uptr pc = Unwind_GetIP(ctx);
  const uptr kPageSize = GetPageSizeCached();
  // Let's assume that any pointer in the 0th page (i.e. <0x1000 on i386 and
  // x86_64) is invalid and stop unwinding here.  If we're adding support for
  // a platform where this isn't true, we need to reconsider this check.
  if (pc < kPageSize) return UNWIND_STOP;
  arg->stack->trace_buffer[arg->stack->size++] = pc;
  if (arg->stack->size == arg->max_depth) return UNWIND_STOP;
  return UNWIND_CONTINUE;
}
_Unwind_Backtrace 的函数原型如下。
// _Unwind_Backtrace() is a gcc extension that walks the stack and calls the
// _Unwind_Trace_Fn once per frame until it reaches the bottom of the stack
// or the _Unwind_Trace_Fn function returns something other than _URC_NO_REASON.
typedef _Unwind_Reason_Code (*_Unwind_Trace_Fn)(struct _Unwind_Context *,
                                                void *);
extern _Unwind_Reason_Code _Unwind_Backtrace(_Unwind_Trace_Fn, void *);
_Unwind_Backtrace 在 stack unwinding 时,对于每一个 frame 都会调用回调函数 Unwind_Trace 将此 frame 的 PC/IP 指令地址保存至 BufferedStackTrace 的成员变量 trace_buffer 中。
StackDepot
本节我们来看下 sanitizer runtime 是如何保存 stack trace 的。
我们在本文前面提到 intercetpr malloc 调用 asan_malloc 来进行内存分配,而 asan_malloc 就是对 __asan::Allocator::Allocate 函数的一层包装。
// compiler-rt/lib/asan/asan_allocator.cpp
void *asan_malloc(uptr size, BufferedStackTrace *stack) {
  return SetErrnoOnNull(instance.Allocate(size, 8, stack, FROM_MALLOC, true));
}

void *Allocate(uptr size, uptr alignment, BufferedStackTrace *stack,
                 AllocType alloc_type, bool can_fill) {
  ...
  m->alloc_context_id = StackDepotPut(*stack);
  ...
}
注意到 __asan::Allocator::Allocate 函数是通过调用函数 StackDepotPut 将 stack unwinding 获取的 stack trace 保存起来。StackDepotPut 会返回一个 context_id,维护 context_id 与 stack trace 的映射关系,后续可以通过 context_id 找到对应的 stack trace。
存储 stack trace 的核心数据结构就是 StackDepot,代码位于:
compiler-rt/lib/sanitizer_common/sanitizer_stackdepotbase.h
compiler-rt/lib/sanitizer_common/sanitizer_stackdepot.h
compiler-rt/lib/sanitizer_common/sanitizer_stackdepot.cpp
// FIXME(dvyukov): this single reserved bit is used in TSan.
typedef StackDepotBase<StackDepotNode, 1, StackDepotNode::kTabSizeLog>
    StackDepot;
static StackDepot theDepot;

u32 StackDepotPut(StackTrace stack) {
  StackDepotHandle h = theDepot.Put(stack);
  return h.valid() ? h.id() : 0;
}

StackTrace StackDepotGet(u32 id) {
  return theDepot.Get(id);
}
StackDepotPut函数,参数类型是 StackTrace(BufferedStackTrace 是 StackTrace 的子类),返回值类型是 u32。存储 stack trace,返回一个 id,id 与 stack trace 是一一对应关系。StackDepotGet函数,参数类型是 u32,返回值类型是 StackTrace。根据 id 返回对应的 stack trace。
StackDepotNode 和 StackDepotBase/StackDepot 的成员变量如下所示。
StackDepotNode。成员变量 StackDepotNode *link; 存储指向下一个 StackDepotNode 的指针,即多个 StackDepotNode 组成一个链表。成员变量 id 用于标识该 StackDepotNode/StackTrace。成员变量 tag 的可能取值是 TAG_UNKNOWN(0), TAG_ALLOC(1), TAG_DEALLOC(2), TAG_CUSTOM(100) 表示 stack trace 的来源。成员变量 size 就是用于表示 stack trace 的深度,成员变量 stack 是个数组,数组每个元素用于存储 stack trace 每一帧的 pc。
StackDepot/StackDepotBase。StackDepot 通过 hash table 来存储 StackDepotNode,hash table 维护了 1«20 个 tab,每 1«12 个 tab 又组成了一个 part。每个 tab 存储的是指向 StackDepotNode 链表第一个元素的指针。
struct StackDepotNode {
  StackDepotNode *link;
  u32 id;
  atomic_uint32_t hash_and_use_count; // hash_bits : 12; use_count : 20;
  u32 size;
  u32 tag;
  uptr stack[1];  // [size]
  ...
};

template <class Node, int kReservedBits, int kTabSizeLog>
class StackDepotBase {
  atomic_uintptr_t tab[kTabSize];   // Hash table of Node's.
  atomic_uint32_t seq[kPartCount];  // Unique id generators.
  ...
};
StackDepot hash table 示意图如下:
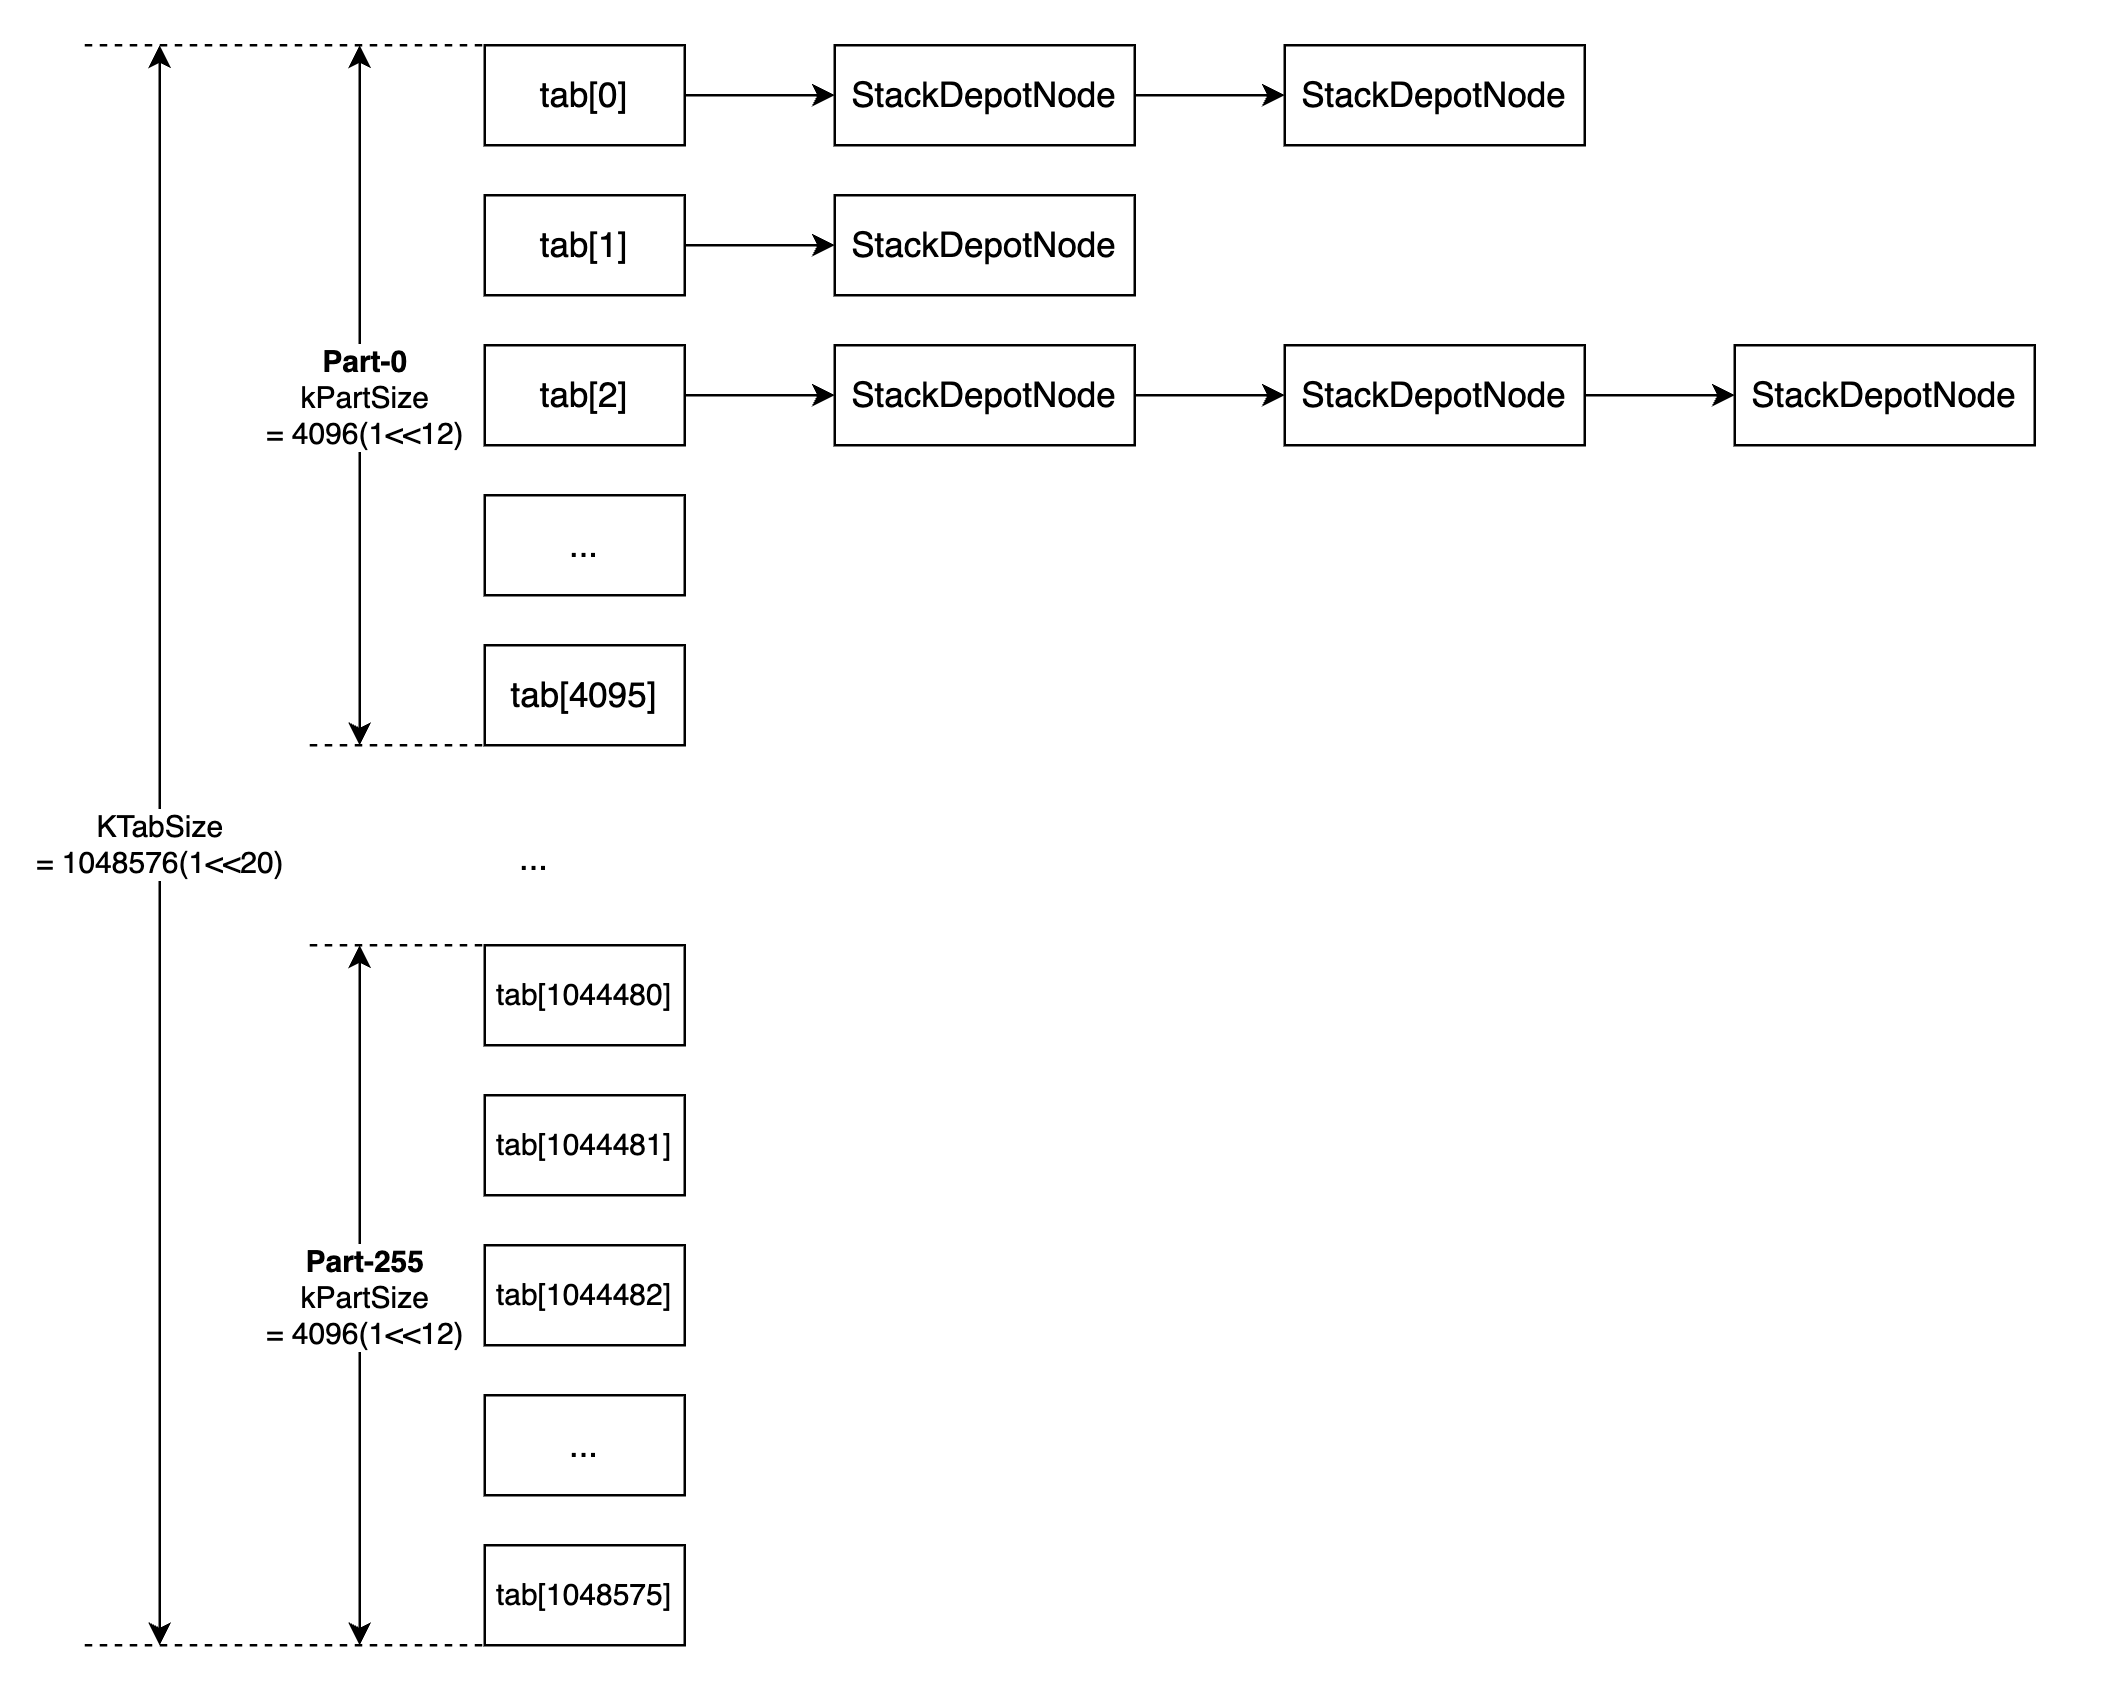
对于一个给定的 stack trace,首先计算出该 stack trace 的 hash 值记作 h,然后计算
h % kTabSize找到存储该 stack trace 的 tab。判断当前给定的 stack trace 是否已经在tab[h % kTabSize]对应的链表中。如果不在,就申请一块内存,在这块内存上根据给定的 stack trace 构造 StackDepotNode,然后将该 StackDepotNode 插入到tab[h % kTabSize]对应的链表开头。 那么 StackDepotNode 的 id 是怎么计算的呢?每 1«12 个 tab 组成了一个 part,数组seq[kPartCount]存储的是每个 part 中当前已经存储了多少个 StackDepotNode。通过计算h % kTabSize / kPartSize找到存储该 stack trace 的 tab 所在的 part。对于一个新的 StackDepotNode 对应的 id 就是(seq[part] + 1) | (part << kPartShift)。对于一个给定的 id,首先通过
uptr part = id >> kPartShift;找到该 id 对应的 StackDepotNode 位于哪个 part。遍历该 part 中的 1 «12 个 tab,在每个 tab 链表中寻找是否存在与给定 id 相等的 StackDepotNode。
关于 sanitizer runtime 是如何保存 stack trace 的,可以仔细阅读下 StackDepot 的代码实现,这部分代码非常值得学习,这里就不一一贴代码了。